On this page
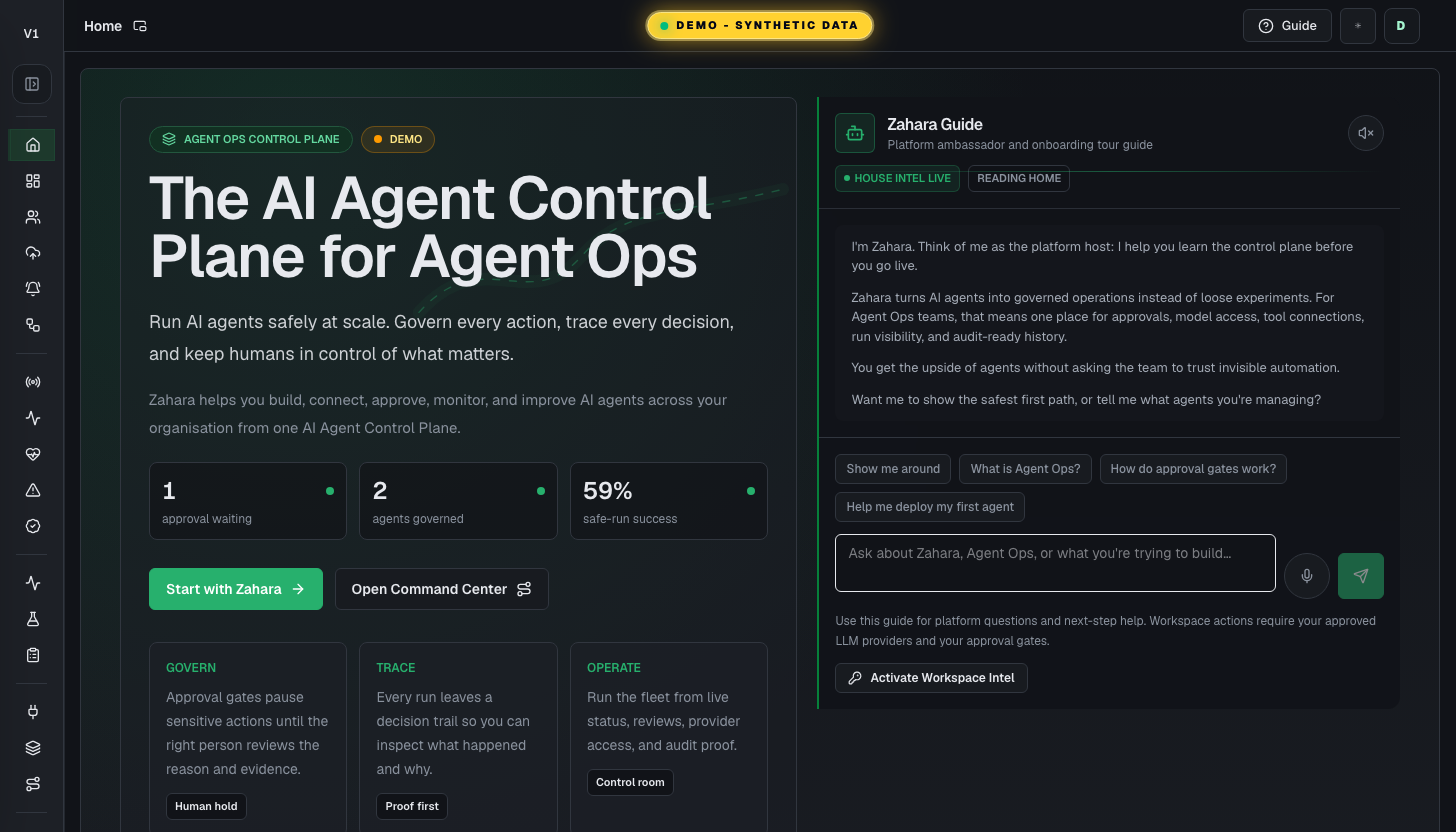
Zahara is the operating layer for production AI agents.
Agent demos are easy. Running agents inside a real company is the hard part: who approved the action, what tools were touched, which credentials were used, what failed, what changed, and what evidence proves it. Zahara governs the work you run through it, and records what agents running elsewhere report to Trace Connect.
Start with an agent or workflow you already have. Import its setup as a reviewable Draft, record safe test activity through Trace Connect, then follow the same run through Trace, Inspect, and Audit. This path works without Thomas, Zahara Guide, a model provider, or live customer data.
A vendor-neutral agent control plane
Zahara keeps imported agents, workspace access, runs, cost evidence, and audit history in one operating record. Trace Connect can also observe sender-reported activity from an outside agent.
Governance before the agent acts
Work dispatched through a configured Zahara route can use approval gates, credential boundaries, model routes, predicted-cost checks, run traces, and Audit evidence. Actual provider charges are known after dispatch and are not subject to a hard spending ceiling. Verify each control for the active workspace.
Inspectable work, not agent claims
Zahara keeps run IDs, status, cost, latency, events, versions, and Audit history visible when the data is available. Missing or sender-unreported values stay unavailable instead of becoming zero.
Start with the job in front of you
The manual is reference material. These paths get a new operator to the right surface without reading the whole page first.
Add one existing agent, send safe test activity, and confirm the same completed and failed runs in Trace, Inspect, and Audit.
Bring in a file or pasted config as a review item. Create a Draft only after checking the mapped fields and warnings.
Use Inspect, Trace, and Audit together so the answer is grounded in run evidence.
Open Command Center first, read what needs attention, then follow the safest next action.
Invite a teammate with the smallest useful role. Use Copy link when email delivery is unavailable.
Record what happened, what you expected, and the route or run ID. Feedback has no published response-time commitment.
Find the right guide
Core trust path
Build / Import / Connect -> Review -> Activate -> Run -> Inspect -> Audit
Imported agents enter a Zahara review path before they become a Draft. Work executed through Zahara can then use configured approvals, routes, and evidence controls. Trace Connect is a separate observation path for activity that already ran elsewhere.
Workboard flow
Source -> Card -> Runner lease -> Review -> Evidence -> Done
Workboard is Zahara's shared board for work, proof, and review. Loop is optional and should only be used when another pass is worth the added cost.
Connect one agent and prove its work
Use this path when you already have an agent or workflow. You will create a reviewable Draft, record synthetic activity, and prove one completed and one failed run. This changes your Zahara workspace. It does not call a model provider or change the external agent. Use a workspace admin account because token creation and revocation are admin-only actions.
- Action
- Register as the workspace owner or sign in as an admin. On Onboarding, choose Bring in existing agents.
- What you should see
- Import opens for the same signed-in workspace.
- What changed
- Your account and onboarding path are saved.
- If you do not see it
- If the choices are disabled, use Retry. Do not continue while onboarding status is unreadable.
- Action
- Choose Paste config or instructions. Paste a secret-free sample, select Import and map fields, review the mapping, then select Send to Fleet for review.
- What you should see
- Zahara shows detected fields, warnings, and the source record before the agent enters Fleet.
- What changed
- A review record is created. No provider runs and no external system is contacted.
- If you do not see it
- Fix mapping warnings before selecting Send to Fleet for review.
- Action
- Select Open in Fleet review, select Review complete, then select Create Draft.
- What you should see
- Fleet opens the imported agent with Run locked.
- What changed
- The Draft belongs to this workspace and keeps its import evidence.
- If you do not see it
- If Create Draft is unavailable, return to the review and resolve the visible blocker.
- Action
- As an admin, create a Trace Connect token. Choose the HTTP starter recipe, store the one-time token in the named environment variable, and run the recipe with synthetic input.
- What you should see
- The recipe prints one run ID after each of five events. The first three lines repeat the completed run ID; the last two repeat the failed run ID. The token request count changes.
- What changed
- Zahara stores sender-reported activity. The external agent remains outside Zahara execution control.
- If you do not see it
- If token controls are missing, ask a workspace admin to create and later revoke the token. If intake fails, verify the active workspace and token. Never paste the one-time token into Feedback or docs.
- Action
- Use the two distinct run IDs printed by the starter recipe. Open the completed run and the failed run, then follow each through Trace, Inspect, and Audit.
- What you should see
- Identity, status, event count, and available cost or token evidence agree. Missing cost stays Unavailable.
- What changed
- Nothing. These pages are read-only until you choose an explicit action or export.
- If you do not see it
- If an ID differs, stop and return to the selected Trace run instead of comparing unrelated records.
- Action
- As an admin, select Revoke for the test token, then confirm a replay is denied.
- What you should see
- The token is marked revoked. The completed and failed run evidence remains available.
- What changed
- Future intake with that token is blocked. Existing evidence is preserved.
- If you do not see it
- If the token is still active, confirm the workspace and revoke it before leaving the test.
System map
Import brings a config, file, or repository source into review and then Fleet. Gateway and approvals apply only when the matching Zahara execution path is configured. Trace Connect receives activity from outside runtimes and does not grant Zahara execution control over them. Inspect, Trace, and Audit show the evidence Zahara received or created.
Verify an audit chain yourself
Zahara exports include `prev_hash` and `row_hash` so a reviewer can check the chain without trusting the dashboard. Open the standalone verifier, drop in a JSON audit or decision-ledger export, and the browser recomputes the SHA-256 hashes locally. Full-chain exports are checked from genesis; filtered compliance exports are checked as segments from their included starting hash. No login and no server call are required.
What Zahara is not
Teams coming from agent frameworks, model APIs, or no-code tools often underestimate what Zahara does. Here is the fastest correction.
- Import creates a Zahara review record and Draft. Trace Connect records activity from an agent that continues to run outside Zahara.
- Trace Connect is observation, not remote execution control. It cannot prove that the sender reported every event.
- Zahara is not a model host. Configured Gateway routes use your model-provider credentials; importing an agent does not place its provider calls under Zahara control.
- A public review link does not authorize a decision. Approval or denial requires signing in as an operator or admin in the review workspace.
- Stopping Zahara-governed work prevents later dispatch or result commit; it cannot undo provider spend or an external action already completed.
- Zahara does not prove that an agent caused a business result. It shows the reported result, attribution source, and related operational evidence.
Glossary
These are the words Zahara uses in the product. Use the role terms to understand who should act, and the platform terms to understand what each surface proves.
Roles
- Operator
- A workspace role that can operate agents and make human-review decisions.
- Viewer
- A read-only workspace role. A viewer cannot approve or deny a human review.
- Admin
- A workspace role that can manage credentials and team access, operate agents, and make human-review decisions.
Platform terms
- Agent
- A configured AI worker with instructions, model policy, tools, run history, and governance settings.
- Fleet
- The roster of agents in a workspace. Use it to find, review, pause, configure, or inspect one agent.
- Run
- One execution attempt by an agent. A run has identity and status; cost, latency, tokens, and events appear only when Zahara receives that evidence.
- AI Agent Control Plane
- The Zahara system that governs work executed through configured Zahara controls and records the outside activity sent through Trace Connect.
- Control plane
- The Zahara services that manage workspace identity, review, permissions, configured execution, evidence, and Audit. Trace Connect observation does not control the outside runtime.
- Approval
- A human decision point that pauses risky, blocked, or policy-sensitive work before it continues.
- Trace
- The step-by-step path of a run across model calls, tools, approvals, errors, and output.
- Inspect
- The detailed run view for status, latency, cost, tokens, events, output, and error context.
- Audit
- The timestamped evidence log for imports, runs, reviews, evals, credentials, and other important state changes.
- Gateway
- The routing layer for model providers, keys, budgets, and fallback behavior.
- Workboard
- The board where proof work and business work become cards with owners, status, review, and evidence.
- Adapter
- The importer that reads a source format and maps it into Zahara fields for review.
- Slug
- A short URL-safe identifier, like support-triage, used to reference agents or config items.
- Source record
- The evidence of how an agent entered the control plane. It includes the original file, config, or connection, plus the adapter, hash, field mappings, and review warnings. Built agents have a spec history instead.
Trust rules
Zahara only confirms an agent is safe to run when there is real evidence. Every status, count, and run result should come from visible platform data, not estimates.
- Do not claim an agent is ready unless it has evidence.
- Do not trust imports until warnings and mappings have been reviewed.
- Do not treat a run as proven unless Inspect and Audit agree.
- Do not approve tools just because a source requested them.
- Do not accept invented counts, IDs, statuses, agent names, or run details from any assistant.
- If a page has live data, use the page data first.
Zahara Trust Card
What it is
The Zahara Trust Card is the buyer-facing system card for the control plane. It explains what Zahara does, what it does not do, what data and credentials it handles, which safeguards exist, and which limits users should understand before trusting Zahara with live agents.
Value to users
It gives buyers, AgentOps teams, security reviewers, and customer admins a concise trust artifact before they connect providers, invite teammates, or route agents through Gateway.
Use it when
- A prospect asks how Zahara is governed before they trust it to govern agents.
- A team needs a plain-language security and control summary for buyer review.
- An operator wants to explain Zahara's architecture, data handling, evals, audit proof, and limits without overclaiming compliance certifications.
- A customer needs one place to understand what Zahara controls versus what remains their responsibility.
Next safe action
Read the Trust Card first, then open Gateway, Credentials, Team, Evals, Approvals, and Audit to verify the live controls in the workspace.
Related Guide pages
Options and features
| Option | What it does | Value it adds | How to use it |
|---|---|---|---|
| System purpose | States that Zahara is the AI agent control plane for building, importing, connecting, governing, observing, evaluating, and auditing agents. | Prevents buyers from mistaking Zahara for only a builder, only a model gateway, or only a monitoring dashboard. | Use it as the first paragraph in buyer, security, or partner review conversations. |
| Architecture map | Shows how Studio, Import, Fleet, Gateway, Approvals, Workboard, Inspect, Evals, and Audit fit together. | Explains the full operating loop instead of selling disconnected feature names. | Start with the System Map, then drill into the linked page guides for each surface. |
| Data and credential handling | Explains that users bring provider keys and external systems, while Zahara stores workspace credentials, routes model calls through Gateway, and records operational evidence. | Clarifies what Zahara touches and what remains in customer-owned providers. | Review Credentials, Gateway, and Integrations before live setup. |
| Governance controls | Summarizes approval gates, role-based team access, spend controls, route limits, eval policies, and audit exports. | Turns governance into inspectable controls instead of a vague promise. | Open Approvals, Team, Gateway, Evals, and Audit to confirm the controls are configured. |
| Known limits | Names boundaries such as model/provider behavior, customer configuration, third-party availability, and evidence that must be verified in live workspace data. | Builds trust by making Zahara's limits explicit instead of hiding them. | Read this before making compliance, safety, or uptime claims outside verified evidence. |
| Evidence path | Points reviewers to Inspect, Evals, Approvals, and Audit for proof. | Shows how a user can verify claims from live records rather than relying on screenshots or marketing copy. | Use matching IDs across run, approval, eval, and audit records. |
Basic workflow
- 1Read the Trust Card before connecting live provider keys or external systems.
- 2Confirm the system purpose and architecture map match the buyer's intended use case.
- 3Review data handling and credential boundaries before adding provider keys.
- 4Confirm team roles, approval gates, Gateway route limits, and eval policies are configured.
- 5Run one controlled proof path and compare Inspect, Evals, Approvals, and Audit evidence.
- 6Use known limits to keep sales, security, and customer-facing claims grounded in actual evidence.
Proof that it worked
- The Trust Card names what Zahara does and does not do.
- The Trust Card links the control surfaces that enforce governance.
- Credentials, Gateway, Team, Approvals, Evals, Inspect, and Audit can be opened to verify live controls.
- Claims stay limited to source-of-truth, tamper-evident, signed/timestamped evidence, and evidence packs unless a formal certification exists.
- Known limits and customer responsibilities are visible before live setup.
Before you start
- Confirm you are on /docs/trust-card and looking at the right workspace.
- Read visible status, warning, or empty-state text before clicking an action.
- If the page shows IDs, copy the relevant agent, run, onboarding, or request ID before switching pages.
If you get blocked
- If a buyer asks for a certification, do not improvise. Share the Trust Card and only claim certifications that have formal evidence.
- If the reviewer needs proof, open the linked Gateway, Credentials, Team, Approvals, Evals, Inspect, or Audit section instead of relying on summary copy.
- If a live control is not configured yet, state that the workspace still needs setup before agents should run real work.
What to confirm
- Am I on /docs/trust-card in the intended workspace?
- Which visible status, warning, or ID proves the current state?
- Which linked evidence page confirms this Zahara Trust Card result?
Command Center
What it is
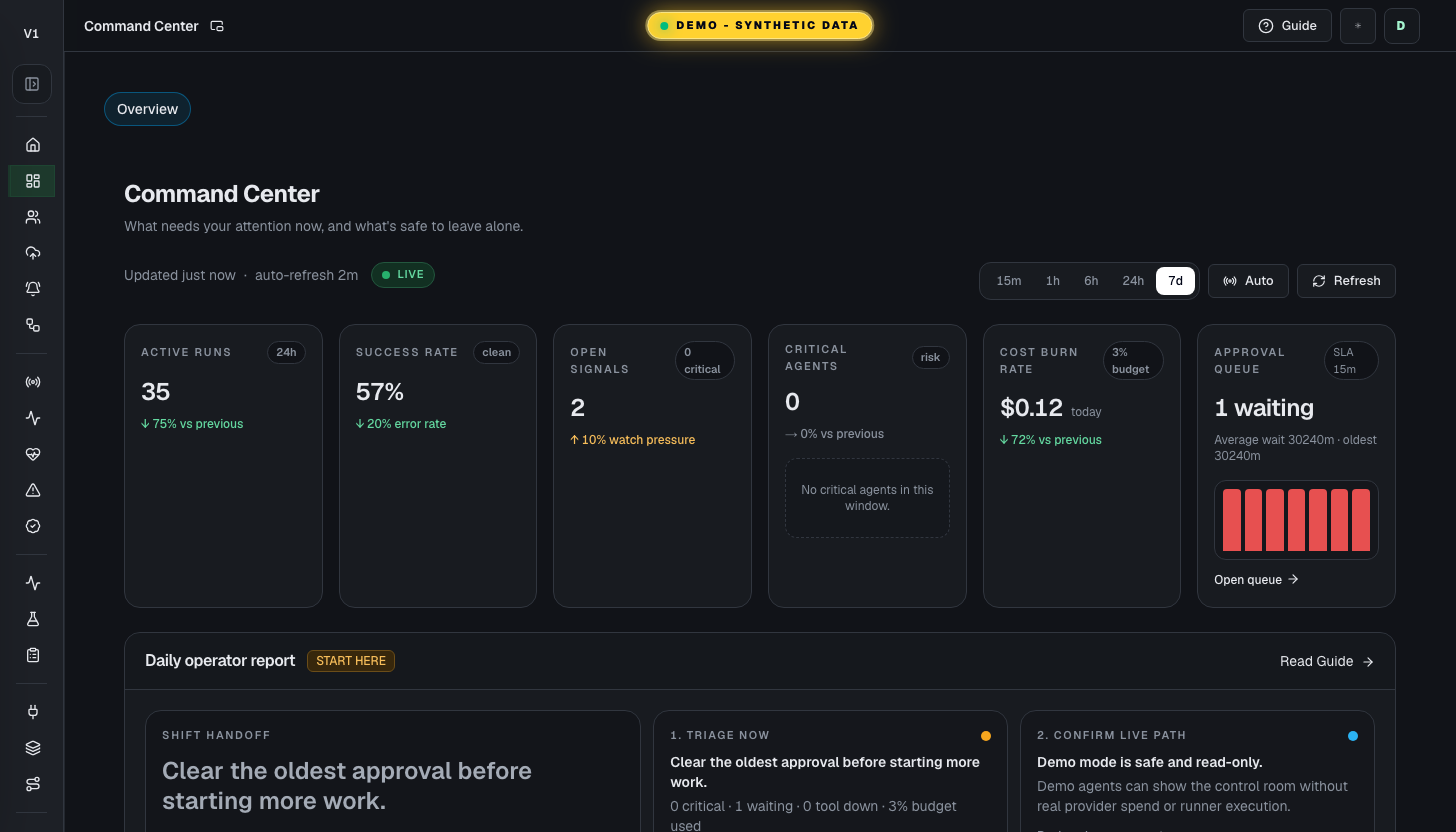
Command Center is the daily operating room for a workspace: what needs you now, what is safe to leave alone, and proof of what just ran.
Value to users
It helps a team start from the right action instead of hunting through Fleet, Approvals, Inspect, Gateway, and Audit one page at a time.
Use it when
- Start your day by seeing critical agents, waiting approvals, down tools, cost, and active agents in one strip.
- Launch the right second-screen monitor for the role you are working: workspace, runtime, fleet, queue, approvals, or a single agent.
- Decide which warning needs a human and which parts of the fleet can keep running.
- Use approval aging and tool failure impact cards to see which reviews or integrations are blocking real work.
- Use the Agent status treemap and Fleet dependency graph to understand what else could break before changing tools or agents.
- Give a new reviewer a quick read on recent runs, failures, model spend, tool health, and quality checks.
Next safe action
Open the highest-risk item in What needs you, then use approval age, tool failure impact, or the linked detail page to approve, pause, fix, or inspect it.
Options and features
| Option | What it does | Value it adds | How to use it |
|---|---|---|---|
| Time window | Changes the activity period used by the run trend, cost, and health panels. | Keeps the page focused on a live incident or a longer pattern. | Pick the shortest useful window first, then widen it if the story is unclear. |
| Page pop-out | Opens the dedicated live monitors for Command Center, Observe, Fleet, Workboard, Approvals, and a single agent from one app-header control. | Lets an AgentOps team put different walls on different physical screens without changing shared workspace state. | Use the small pop-out icon beside the page title in the app header; the new window hides the left nav and header. |
| Daily operator report | Turns the top workspace metrics into a start-of-shift checklist: triage now, confirm live path, watch spend, and leave proof. | Gives the operator a plain-English handoff they can read out loud before opening detail pages. | Read the Shift handoff copy first, follow the highest-risk link, then return to Command Center after the action is handled. |
| Live action readiness | Shows whether the workspace has a tested provider key, an online runner, queued Workboard work, and operator access. | Tells the operator whether it is safe to start a live card or whether the demo should stay monitor-only. | Read this card before pressing Start next in Workboard. Fix the linked setup item first if the card says SETUP. |
| What needs you | Lists agents, approvals, tool requests, budget issues, and latency warnings that need a person. | Turns scattered alerts into a clear review queue. | Start with red critical rows, then handle amber review rows if the fleet is otherwise healthy. |
| Approval queue age | Buckets pending approvals by wait time: under 1h, 1-6h, 6-12h, 12-24h, and 24h+. | Shows whether review work is becoming overdue before the queue looks large. | Click a bucket to open Inspect filtered to approvals in that age band, then clear the oldest reviews first. |
| Tool failure impact | Expands DOWN or WARN tools with affected agents, estimated blocked cost, and the suggested action. | Connects a tool outage to the exact agents and money at risk. | Open the red or amber tool card, review the affected agents, then investigate or dismiss it. |
| Guardrails | Shows whether latency, error rate, daily cost, and review wait are inside target. | Makes it obvious when the workspace is drifting before a customer notices. | Open Alerts or Gateway when a guardrail is breached or close to breach. |
| Metric sparklines | Shows active runs, success rate, open signals, critical agents, cost burn, and approval queue trend. | Gives ops a compact first read before they open detail pages. | Read this row first, then use the trend direction to decide whether the workspace is calming down or heating up. |
| Customize layout | Lets an operator reorder Command Center cards and reset them to the default order. | Keeps each browser or monitor station focused on the blocks that operator needs first without changing shared workspace data. | Choose Customize layout, drag cards or use Move up / Move down, then choose Done customizing. The order is saved in this browser only. |
| Critical issues timeline | Shows incident windows for outages, error rate, budget spikes, tool down, and approval backlog over the last 24 hours. | Turns isolated alerts into an operational incident story. | Start with active red bars, then compare amber warnings with What needs you. |
| Agent status treemap | Groups the fleet by Healthy, Warning, Critical, and Paused. | Shows whether risk is concentrated or spread across the fleet. | Click a rectangle to open Fleet filtered to that status. |
| Fleet dependency graph | Maps agents, tools, APIs, and policies with cascade risk and fallback detail. | Shows what breaks downstream if a provider, tool, or policy node fails. | Click a node to enter What-if mode, read the detail panel, then export PNG if the graph needs to go into an incident note. |
| Safe to leave alone | Collapses healthy system checks into a low-priority section at the bottom of Command Center. | Keeps operator focus on active risk while still proving the quiet parts are healthy. | Open it when handing off a shift or when a reviewer asks what can keep running without attention. |
| Proof of what ran | Shows recent runs with agent, model, status, cost, latency, and the note that explains the outcome. | Lets reviewers verify behavior without guessing from a summary metric. | Use Recent runs for the quick read, then open Audit or Inspect for the full trail. |
Basic workflow
- 1Open Command Center at the start of a session.
- 2Use the page-title pop-out to open the walls this operator station needs on second, third, or fourth screens.
- 3Use Customize layout when this browser or monitor station needs a different card order.
- 4Read Daily operator report first so the shift starts from the right human action.
- 5Check Live action readiness before running a live Workboard card.
- 6Read the top strip for critical agents, waiting approvals, tool health, cost, and active agents.
- 7Handle the highest-risk row in What needs you.
- 8Use Approval queue age to clear the oldest pending reviews before they miss the review target.
- 9Expand any DOWN or WARN tool card to see affected agents and blocked cost.
- 10Use Critical issues timeline and Fleet dependency graph when risk might cascade.
- 11Check Guardrails and Activity trend to see whether the workspace is improving.
- 12Open Safe to leave alone only when you need the healthy-system proof.
- 13Use Proof of what ran before calling the issue resolved.
Proof that it worked
- No 404 or app error.
- The top strip, What needs you, Guardrails, Activity trend, Tool health, Quality, and Recent runs are visible.
- The app header exposes a small pop-out icon beside the current page title.
- The page pop-out opens the current surface in a chrome-free window instead of a fixed monitor picker.
- The Command Center monitor opens the same operating story in a read-only second-screen view.
- Customize layout reorders cards locally and Reset layout restores the default order.
- Daily operator report shows triage, live path, spend, and proof checklist items.
- Live action readiness names provider key, runner, Workboard, and operator access status.
- Critical and warning rows link to the page where the user can act.
- Approval queue age shows pending buckets and an overdue-review callout when old reviews are waiting.
- Tool cards show affected agents and suggested action for DOWN or WARN tools.
- Metric sparklines show trend direction across the operating strip.
- Critical issues timeline renders incident windows or a clear empty state.
- Agent status treemap opens Fleet filtered by status.
- Fleet dependency graph supports node detail, What-if cascade mode, search, and PNG export.
- Safe to leave alone expands and collapses without hiding active-risk sections.
- Recent runs show status, cost, latency, and a clear note.
Before you start
- Confirm you are on /command-center and looking at the right workspace.
- Read visible status, warning, or empty-state text before clicking an action.
- If the page shows IDs, copy the relevant agent, run, onboarding, or request ID before switching pages.
If you get blocked
- If live data cannot load, do not treat the page as empty. Retry refresh, then check Fleet or Evals to see whether the API or one panel is down.
- If a metric spikes, open the linked detail page before changing an agent.
- If approval age is high, clear the oldest pending review before starting more live work.
What to confirm
- Am I on /command-center in the intended workspace?
- Which visible status, warning, or ID proves the current state?
- Which linked evidence page confirms this Command Center result?
Onboarding
What it is
Onboarding is the first signed-in choice. It sends you to a guided sample, a new build, or an existing-agent import without marking the path complete before the destination succeeds.
Value to users
It gives a new operator one clear starting decision while preserving server-backed progress and a safe retry when Zahara cannot read the current onboarding state.
Use it when
- A first-time user signed in and needs to understand where to begin.
- A user already has agents and wants to start with import and evidence.
- A user wants a confirmed sample tour before adding data.
Next safe action
For the completed first-proof path in this manual, choose Bring in existing agents. Import opens so you can review a secret-free sample and create a run-locked Draft.
Related Guide pages
Fresh screenshots are pending. Capture updated demo-safe images before publishing this guide publicly.
Use the written steps until a current, privacy-safe image is available. Add only an image that shows this exact page and state.
Options and features
| Option | What it does | Value it adds | How to use it |
|---|---|---|---|
| Explore with Zahara | Opens the guided Command Center tour after asking before sample data is created or reused. | Lets you inspect clearly labeled sample evidence without a provider credential, external contact, or spend. | Confirm the sample-data prompt only when you want the tour to add or reuse its labeled fixture. |
| Build a new agent | Opens Studio Vibe Intake. | Provides a separate build path for a new agent idea. | Use this only when building is part of your accepted release scope. The essential first-proof path does not depend on it. |
| Bring in existing agents | Records the import path and opens Import. | Starts from work you already have and preserves source, mapping, warning, and Draft evidence before a run is allowed. | Choose this for a file, pasted config, repository source, or an outside runtime that you want to observe. |
Basic workflow
- 1Open Onboarding after first sign-in or signup.
- 2Confirm the page can read your onboarding status. If it cannot, the choices stay disabled and Retry is visible.
- 3Choose Bring in existing agents for this manual's essential first-proof path.
- 4Confirm Import opens before treating the onboarding step as successful.
- 5If you choose Explore with Zahara, read the sample-data state and confirm the separate consent dialog.
Proof that it worked
- The page shows a centered control plane welcome modal over the blurred app.
- The visible choices are Explore with Zahara, Build a new agent, and Bring in existing agents.
- Explore with Zahara is marked Recommended and asks before adding or reusing sample data.
- Build and Bring in do not create sample tour data.
- Bring in existing agents opens `/import` and preserves the server-backed path state.
- The page guide opens from the app header and links to `/docs#onboarding`.
Before you start
- Confirm you are on /onboarding and looking at the right workspace.
- Read visible status, warning, or empty-state text before clicking an action.
- If the page shows IDs, copy the relevant agent, run, onboarding, or request ID before switching pages.
If you get blocked
- If you already have an agent, choose Bring in existing agents and confirm Import opens.
- If you want the sample tour, read its data state and confirm the consent dialog before anything is created.
- If onboarding cannot read your status, use Retry. The choices remain disabled until that read succeeds.
What to confirm
- Am I on /onboarding in the intended workspace?
- Which visible status, warning, or ID proves the current state?
- Which linked evidence page confirms this Onboarding result?
Trace Connect
What it is
Trace Connect is an advanced integration for teams that already have agents running in external tools and want those runs observed in Zahara before migration.
Value to users
It lets an operator start with proof before a rewrite. External runs create Zahara run, step, Observe, and Audit evidence while the original agent keeps running where it already lives.
Use it when
- A team has an OpenAI, LangGraph, CrewAI, AutoGen, n8n, or custom agent already running.
- An operator needs daily visibility before a full import or migration is worth doing.
- A user wants to inspect sender-reported latency, tool calls, cost, errors, and Audit evidence from an outside runtime.
Next safe action
A workspace admin opens Observe, then Connect, and creates a scoped token. Run the HTTP starter recipe with synthetic input to create one completed and one failed run, then confirm both in Trace, Inspect, and Audit before connecting real traffic.
Related Guide pages
Fresh screenshots are pending. Capture updated demo-safe images before publishing this guide publicly.
Use the written steps until a current, privacy-safe image is available. Add only an image that shows this exact page and state.
Options and features
| Option | What it does | Value it adds | How to use it |
|---|---|---|---|
| Trace Connect access | Creates and revokes scoped ingest tokens for external runtimes. | Lets a running worker connect without borrowing a browser JWT. | Name the bridge, create the token, copy the one-time token or snippets, then store it in the worker environment. |
| Starter recipes | Shows copyable OpenAI Agents, LangGraph, CrewAI, AutoGen, n8n, and Dify wrappers. | Turns this advanced HTTP intake into a paste-ready first proof path for common agent stacks. | Pick the runtime, create a token for a paste-ready secret, copy the recipe, then run one safe heartbeat before production traffic. |
| Send test heartbeat | Uses the one-time `ztc_...` token to send a safe terminal heartbeat event. | Proves the token, API path, run creation, token request count, and Trace link before a real worker is connected. | After creating a token, click Send test heartbeat and open the returned Trace run. |
| POST /trace-connect/tokens | Creates a token for the current workspace/team and returns the plain secret once. | Gives onboarding a safe, repeatable setup step for OpenAI Agents, LangGraph, CrewAI, AutoGen, n8n, and custom workers. | Admins create tokens; Zahara stores only the hash and display prefix. |
| POST /trace-connect/events | Accepts a single run, tool, model, handoff, guardrail, message, or error event. | Creates the normalized evidence Zahara can show in Observe and Audit. | Use `Authorization: Bearer ztc_...` or an authenticated operator session, include `trace_id`, `event_type`, and a safe `name`, then add optional model, provider, tokens, cost, framework, span, and metadata fields. |
| DELETE /trace-connect/tokens/{token_id} | Revokes a token without deleting the audit trail or prior run evidence. | Gives operators a clean rotation path when a bridge is retired or a customer environment changes. | Use the setup surface or call the endpoint as an admin in the same workspace. |
| GET /trace-connect/events | Lists recent Trace Connect events for the active workspace. | Gives operators a quick proof check without leaving the platform. | Filter by `trace_id` when confirming a single external run. |
| Agent link | Links incoming events to an existing Zahara agent when `agent_id` or `agent_slug` matches. | Keeps external evidence attached to the right Fleet record without creating ghost agents. | Use `agent_slug` for existing Zahara agents; omit it for generic external traces that are not mapped yet. |
| Secret-safe metadata | Redacts secret-looking keys and previews before storing event payloads. | Keeps Trace Connect useful for debugging without turning it into a credential sink. | Send only operational metadata; Zahara still redacts common key, token, password, and authorization fields. |
Basic workflow
- 1Pick one external agent or workflow to observe.
- 2Confirm the workspace and admin/operator role are correct.
- 3Create a Trace Connect token and store the one-time secret in the external runtime.
- 4Click Send test heartbeat and verify Zahara accepts a terminal `run.completed` event before adding the token to production code.
- 5Choose the matching starter recipe for OpenAI Agents, LangGraph, CrewAI, AutoGen, n8n, or Dify.
- 6Send a `run.started` or `message` event with a stable `trace_id`.
- 7Send tool, model, handoff, guardrail, or error events with `span_id` when available.
- 8Send `run.completed` or `run.error` when the external run finishes.
- 9Open Observe / Health or Observe / Trace and confirm the run evidence is visible.
- 10Open Audit and filter for `trace_connect.event_received` if the operator needs tamper-evident proof.
- 11Revoke any token that was created only for testing.
Proof that it worked
- Trace Connect token tooling can list, create, and revoke scoped tokens.
- Token create responses include a one-time secret plus curl and Python snippets.
- Send test heartbeat accepts one safe event, increments the active bridge count, and links to the Trace run.
- The starter recipe picker includes OpenAI Agents, LangGraph, CrewAI, AutoGen, n8n, and Dify.
- Selecting a recipe updates the setup guidance, emitted event types, and copyable snippet.
- `POST /trace-connect/events` returns `ok: true`, `run_id`, and the normalized event item.
- A Zahara `Run` row is created with source `trace_connect` and request id equal to `trace_id`.
- Tool and model events create run-step evidence for Observe and Inspect.
- Audit records `trace_connect.event_received` for every accepted event.
- Audit records token create/revoke events for credential changes.
- Events are scoped to the active workspace and are not visible to other accounts.
- Secret-looking metadata fields are redacted before they are stored.
- Trace Connect records what the sender supplies. It does not control outside execution or prove that every event was reported.
- Reported or estimated cost is labeled by source. Missing cost remains unavailable.
Before you start
- Confirm you are on /observe/connect and looking at the right workspace.
- Read visible status, warning, or empty-state text before clicking an action.
- If the page shows IDs, copy the relevant agent, run, onboarding, or request ID before switching pages.
If you get blocked
- If events do not appear, send a test heartbeat before wiring production traffic.
- If the token fails, create a fresh token and copy the one-time secret into the external runtime.
- If the event is unmapped, include agent_id or agent_slug only after the target agent exists in Fleet.
What to confirm
- Am I on /observe/connect in the intended workspace?
- Which visible status, warning, or ID proves the current state?
- Which linked evidence page confirms this Trace Connect result?
Import
What it is
Import brings an outside agent source into Zahara for review before it can run. Upload, paste, GitHub, API, and CI/CD paths all land in the same review-first flow.
Value to users
It lets teams reuse existing agent work without blindly trusting it. Zahara now recognizes 39 formats across native specs, Python frameworks, visual builders, cloud platforms, and emerging agent configs, then shows detected format, mapped fields, warnings, tool references, model route, credentials, and secret signals.
Use it when
- Upload a local JSON, YAML, markdown, prompt, OpenAPI, Bedrock, LangChain, CrewAI, n8n, Dify, or other supported source file.
- Paste a config or describe an agent in plain English when a file is not ready yet.
- Scan GitHub or wire API/CI/CD when the source should stay attached to a repo workflow.
- Preserve a source record before activation.
- Check readiness and warnings before creating a Fleet review row.
Next safe action
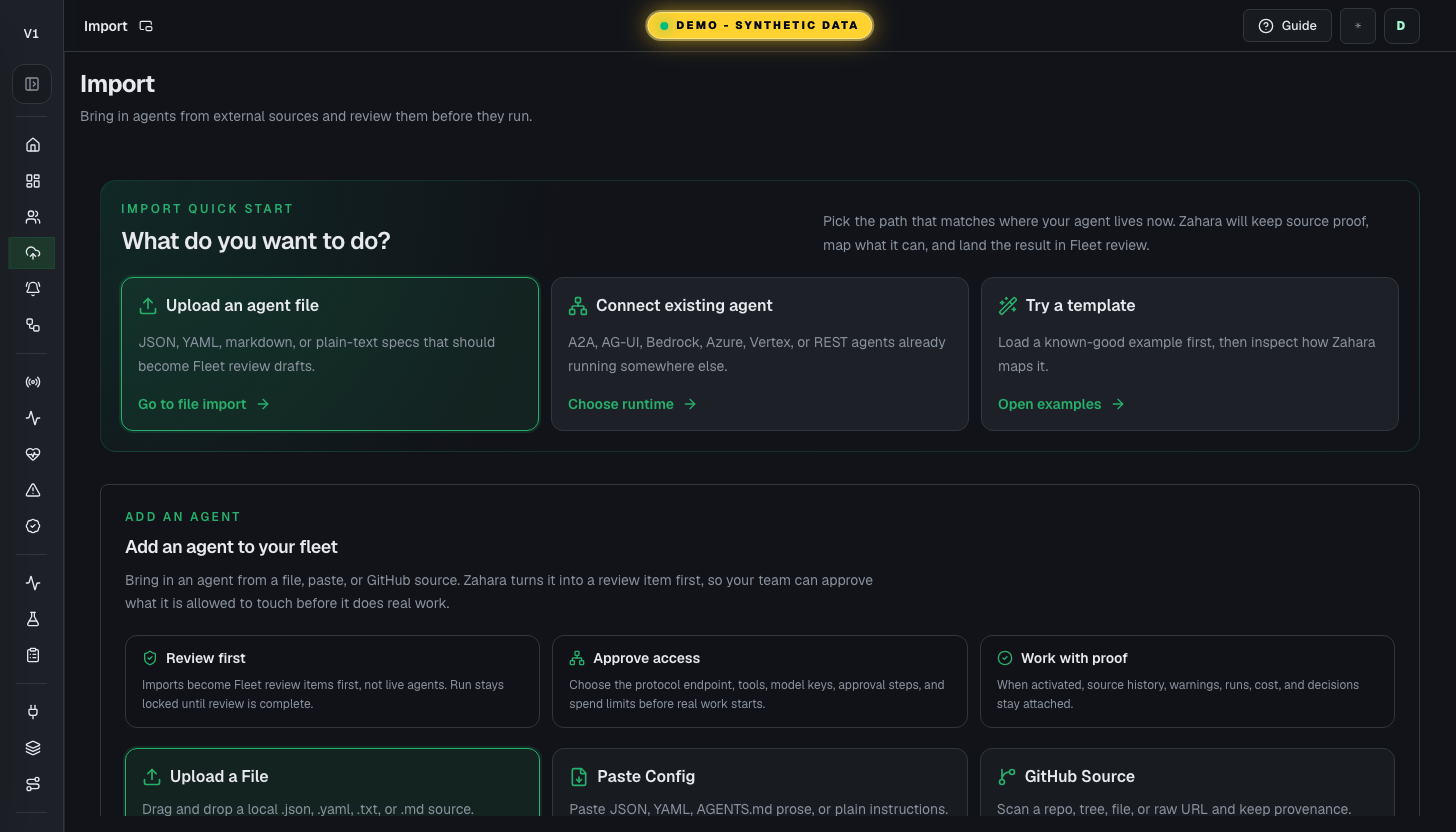
Use Quick Start to choose Upload, Connect, or Template, load the source, confirm the detected adapter, read readiness and warnings, then send it to Fleet review only if it is worth reviewing. An adapter is how Zahara reads and maps your agent's source format.
Options and features
| Option | What it does | Value it adds | How to use it |
|---|---|---|---|
| Quick Start | Separates Upload an agent file, Connect existing agent, and Try a template before the user enters the detailed import area. | A new user can choose intent first instead of guessing which format tab matters. | Pick Upload for a local file, Connect for a remote/cloud agent, or Template when you want a known-good example. |
| Upload a file | Accepts local .json, .yaml, .yml, .txt, and .md sources, auto-detects the adapter, keeps the raw source, and starts Upload -> Review -> Activate. | Users can bring real work in quickly while Zahara keeps the source inactive until review. | Drop the file or click the upload zone, then verify the detected format and readiness panel before sending to Fleet. |
| Paste modes | Lets users paste a config or describe the agent in plain English without leaving the page. | Supports both structured imports and early-stage ideas without turning paste into a confusing side path. | Keep Paste a config for JSON, YAML, markdown, or prompts. Switch to Describe in plain English when you want Zahara to generate the spec for you. |
| GitHub URL scanner | Downloads supported agent files from GitHub and detects the source format. | Lets users start from real work instead of rebuilding agents by hand. | Paste the file or folder URL, scan, choose a candidate, then continue to mapping. |
| 39-format support panel | Groups support into Native, Python Frameworks, Visual Builders, Cloud & Enterprise, and Advanced formats. | Builders can quickly find LangChain, CrewAI, OpenAI, Bedrock, n8n, Dify, OpenAPI + Prompt, Cursor rules, and other ecosystem sources. | Use auto-detect first. Open the format panel when you need to inspect coverage, force a mapping, or check whether a cloud format needs credentials during review. |
| Send to Fleet for review | Creates an onboarding row with preserved source evidence. | Moves the source into the governed Build / Import / Connect -> Review -> Activate loop. | Click only after the readiness panel and warnings have been checked. |
| Supported formats disclosure | Keeps the full format matrix available without competing with the main import action. | Users can move fast first, then expand the deeper format detail only when they need it. | Open it when you want to override auto-detection or check whether a source is full or partial coverage. |
Basic workflow
- 1Choose Upload, Connect, or Template from Quick Start. Choose the tab that matches the source you have right now.
- 2Load the file, paste the config, describe the agent, scan GitHub, or use API/CI/CD.
- 3Confirm the detected adapter or open Supported formats if you need an override.
- 4For cloud and enterprise sources, note credentials that must be set during review.
- 5Review mapped fields, not-mapped fields, warnings, model route, tools, and secrets.
- 6Send to Fleet for review.
- 7Open the new Fleet review row.
Proof that it worked
- One tabbed action area is visible immediately on page load.
- Quick Start scrolls to the matching Upload, Connect, or Template section.
- Upload, paste, and GitHub inputs stay separated.
- Upload explains supported files, source preservation, Fleet review, and version history.
- Supported formats shows 39 formats across the five current tabs.
- Bedrock, Azure, and Vertex show credentials-set-during-review warnings.
- Detected adapter is visible after a source is loaded.
- Readiness panel is present.
- Warnings are preserved.
- Onboarding ID is created after sending to Fleet.
Before you start
- Confirm you are on /import and looking at the right workspace.
- Read visible status, warning, or empty-state text before clicking an action.
- If the page shows IDs, copy the relevant agent, run, onboarding, or request ID before switching pages.
If you get blocked
- If the source does not map cleanly, do not activate it. Read warnings and unsupported fields first.
- If an adapter is unknown, use Supported formats or paste a smaller source before sending to Fleet.
- If secrets appear in the source, remove or rotate them before review.
What to confirm
- Am I on /import in the intended workspace?
- Which visible status, warning, or ID proves the current state?
- Which linked evidence page confirms this Import result?
Fleet
What it is
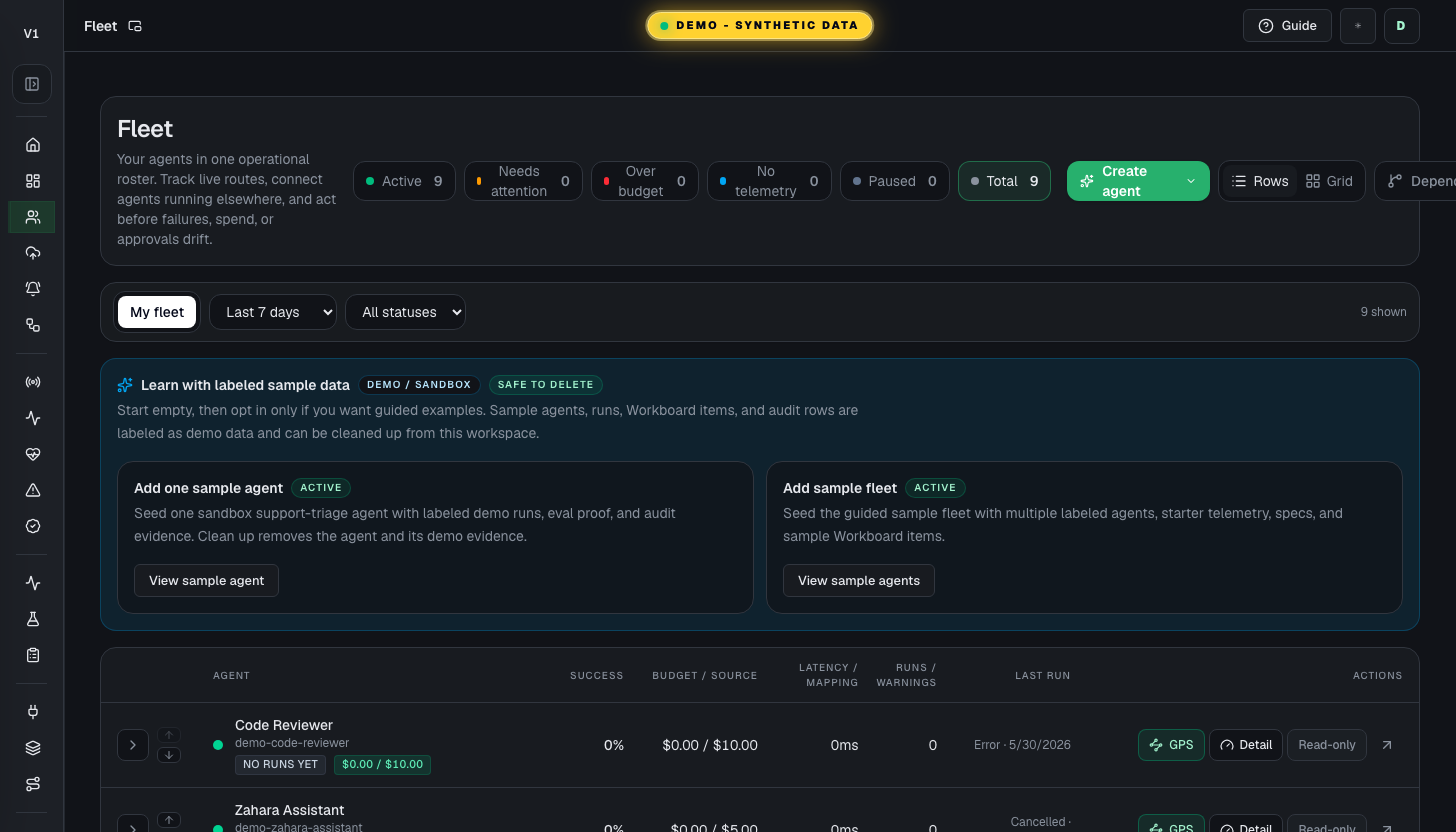
Fleet is the roster of agents in this workspace.
Value to users
It keeps the operational roster clear: which agents exist, what state they are in, whether they need attention, and where to create, import, or open deeper configuration. Fleet is the canonical entry point for new agents because every path lands back in review before trusted work begins.
Use it when
- Find an agent quickly by name, slug, status, or owner. A slug is a short URL-safe identifier like support-triage.
- Use Fleet as an agent roster first, not as a dashboard wall.
- Check active, paused, and attention counts before starting work.
- Use Agent GPS from card or row actions when you need to follow one agent into its live run route.
- Expand one row to review controls, team setup, recent activity, and config links.
- Switch to Dependencies when a provider, model, or tool change could affect multiple agents.
- Load or delete the labeled sample fleet when a new user needs safe demo data.
- Seed a manager-owned Workboard queue from an operating pack.
Next safe action
Start with the status pills and search. If this is a new or demo workspace, use the sample fleet or a manager operating pack. Use Agent GPS when the question is what an agent is doing or what it just did. Then open the one agent that needs attention, use the expanded row for controls, or jump to Agent Cockpit for full configuration.
Options and features
| Option | What it does | Value it adds | How to use it |
|---|---|---|---|
| Create agent - Guided by Thomas | Starts Vibe Intake from Fleet. Thomas interviews the user, builds the operating contract, and prepares the agent for Fleet review. | Gets non-technical users to a governed spec without requiring them to know the Agent Configure structure first. | Choose this when the user can describe the job but has not yet set runtime, tools, approvals, evals, or authority boundaries. It routes to `/studio?v=vibe`. |
| Create agent - Configure myself | Creates a blank governed agent and opens Agent Configure at Identity Brief with the Thomas readiness checklist visible. | Lets technical users or admins set all sections directly while Thomas monitors missing setup. | Choose this when the runtime, tools, approvals, and launch surface are already known. In demo it opens a read-only Configure preview; in live viewer accounts an Operator or Admin role is required. |
| Create agent - Import paths | Opens Import from file, Paste or describe, or Import from GitHub with the source type preselected. | Brings existing agent work under Zahara governance without rebuilding from scratch. | Choose this when the agent already exists in a file, config, repo, or another platform and should enter Fleet review first. |
| Page pop-out | Launches a read-only Fleet monitor for a second screen from the app header. | Keeps active, paused, and attention states visible while operators work elsewhere. | Use the small pop-out icon beside the page title when Fleet should stay visible. Make changes from the full Fleet page, not the monitor. |
| Customize layout | Lets an operator reorder Fleet monitor cards and reset them to the default order. | Supports second-monitor preferences without changing shared Fleet data or exposing mutation controls. | Use it in `/fleet/live`; changes are saved in this browser only, so each operator station can keep its own wall layout. |
| Rows view | Shows agents in the default row/list roster with columns for status, success, budget/source, latency, and warnings. | Keeps Fleet scannable for real operations instead of turning agent management into another dashboard. | Use Rows as the default view when you need to triage agents. Switch to Grid or Dependencies only for a specific scanning or relationship question. |
| Status pills | Filters the roster by active, attention, paused, or total agents. | Turns the top counts into navigation instead of decoration. | Click a pill to narrow the list, then use Clear filters to return to the full roster. |
| Fleet filters and views | Filters by text, status, time window, scope, row view, grid view, or dependency view. | Helps large workspaces find the right agent or relationship quickly. | Start with search or status. Use grid for scanning cards and Dependencies when shared resources matter. |
| Agent GPS | Opens the selected agent's live GPS route at `/agents/[agentId]/live`, with the latest run selected when Fleet has one. | Moves from roster triage to the run graph, live decision feed, Inspect replay, and Audit proof for that exact agent. | Use Agent GPS from card view or the row Actions column when you need to follow what the agent is doing now or replay what it just did. The destination is the Live Run Console / Agent GPS surface. |
| Expanded row | Opens inline controls for one agent without leaving the roster. | Keeps status, daily cap, manager assignment, recent activity, and configuration links close to the row being reviewed. | Use the chevron at the far left to expand one row. Fleet keeps this lightweight: make small roster changes inline, then open Configure for the full settings surface. |
| Configure button | Opens this agent's rich settings page at `/agents/[id]?tab=configure§ion=identity-brief`. | Makes the deep configuration path explicit instead of hiding it behind row click behavior. | Use Configure when you need Identity Brief, Instructions / Behavior, model policy, runtime limits, tools, approvals, alerts, evals, memory, or source sync. |
| Manager and child agents | Shows manager agents with child counts, child health, and expandable child rows. | Lets teams see when one agent supervises a small team without turning Fleet into a complex org chart. | Expand the manager row to reveal child agents. Open Team setup in the expanded row to attach children, set routing defaults, or open the manager inbox. |
| Sample fleet pack | Adds or removes a labeled sample team with demo agents, starter telemetry, specs, runs, and Workboard items. | Lets a new user see the platform working without mixing demo data into a real fleet. | Use Add sample fleet when the workspace is empty or needs safe examples. Use View sample agents to filter to that pack. Use Delete sample fleet when the user is ready to build their own roster. |
| Manager inbox | Opens the Workboard already filtered to one manager team or to blocked manager work. | Keeps manager-owned queues close to the roster where the manager/child relationship is maintained. | Expand a manager row and use Open manager inbox or Open blocked work. |
| Operating packs | Loads starter desks such as Marketing starter desk, Startup ops starter desk, Founder desk starter queue, or a custom starter desk into Workboard. | Gives manager teams useful first cards for routing, proof, and review instead of an empty board. | Choose a pack in the manager row, save it if needed, then Load starter desk. |
| Reusable pack library | Saves a good starter desk as a personal or workspace reusable pack and lets another manager use or duplicate it. | Turns one good manager setup into a repeatable operating pattern. | Name the pack, choose Personal or Workspace visibility, then Save as reusable pack. |
| Scheduled desk refresh | Auto-seeds a saved reusable pack on a cron cadence while skipping still-open cards. | Keeps recurring manager queues alive without duplicating unfinished work. | Pick a reusable pack, add a schedule label and UTC cron expression, then Save refresh. |
| Routing defaults and rules | Maps manager routing lanes and recurring match phrases to child agents. | Makes common handoffs repeatable while keeping the manager decision visible and editable. | Set lane defaults and phrase rules from the manager row, then verify Workboard suggestions before saving a route. |
| Dependencies | Shows shared providers, models, tools, and cross-agent relationships. | Prevents changing a shared resource without seeing what else it touches. | Switch to Dependencies before changing a provider, model route, or tool used by more than one agent. |
| Open cockpit | Opens the detail page for a specific agent. | Moves from fleet-level management to one-agent proof, status, configuration, observe, and changelog controls. | Click the agent row, use the arrow icon, or open Configure directly when the question is about settings. |
Basic workflow
- 1Scan the status pills to see whether the roster is calm or needs attention.
- 2Use Create agent when the next step is new work: Guided by Thomas for plain-language intake, Configure myself for direct setup, or one of the Import paths for existing agent work.
- 3Stay in Rows view for normal roster triage.
- 4Use search or a status filter to narrow the roster.
- 5Use Agent GPS from the card or row when the next question is what one agent is doing or what it just did.
- 6Use Configure directly when you already know the agent's settings need work.
- 7Use the chevron to expand the row when you want roster-level context first.
- 8Check status, spend cap, team assignment, recent activity, and quick links.
- 9For a demo or new workspace, add the sample fleet or load a manager operating pack before judging whether the product is empty.
- 10For a manager row, open the manager inbox, choose an operating pack, save reusable packs, configure scheduled refresh, and set routing defaults when the team needs repeatable queues.
- 11Save small control changes inline.
- 12Open Agent Cockpit, Configure, Inspect, Audit, Studio, or Dependencies when the next action needs a deeper surface.
Proof that it worked
- Counts match expected scope.
- The Create agent dropdown shows Guided by Thomas, Configure myself, and the three import paths.
- Demo viewers see OPEN READ-ONLY PREVIEW for Configure myself; live viewer accounts see that Operator or Admin is required.
- The page pop-out opens the Fleet wall with active fleet, attention, runtime queue, runner state, and a read-only watch list.
- Customize layout reorders cards locally and Reset layout restores the default order.
- No-run agents show dashes instead of fake zero metrics.
- Rows view is the default Fleet experience and remains the main roster surface.
- Agent GPS buttons open `/agents/[agentId]/live` and do not fall through to the cockpit route.
- Only one row expands at a time.
- Rows have a visible Configure button for the full settings page.
- Expanded rows show operational controls, team setup, recent activity, settings/configuration links, and separated destructive actions.
- Manager rows can expand to show child agents when hierarchy is configured.
- The sample fleet banner shows Demo data and Safe to delete when the pack is active.
- Sample fleet controls include Add sample fleet, View sample agents, and Delete sample fleet.
- Manager rows show manager inbox, blocked work, operating pack, reusable pack library, scheduled desk refresh, and routing default controls when manager context is available.
- Dependencies explains shared-resource impact before the graph appears.
Before you start
- Confirm you are on /agents and looking at the right workspace.
- Read visible status, warning, or empty-state text before clicking an action.
- If the page shows IDs, copy the relevant agent, run, onboarding, or request ID before switching pages.
If you get blocked
- If agents are missing, check search, status pills, time window, and whether sample agents are hidden.
- If an agent shows no runs, open the agent Status page and confirm whether there are truly no runs or telemetry is unavailable.
- If Dependencies shows shared risk, inspect what else could break before changing a provider, model, or tool.
What to confirm
- Am I on /agents in the intended workspace?
- Which visible status, warning, or ID proves the current state?
- Which linked evidence page confirms this Fleet result?
Inspect
What it is
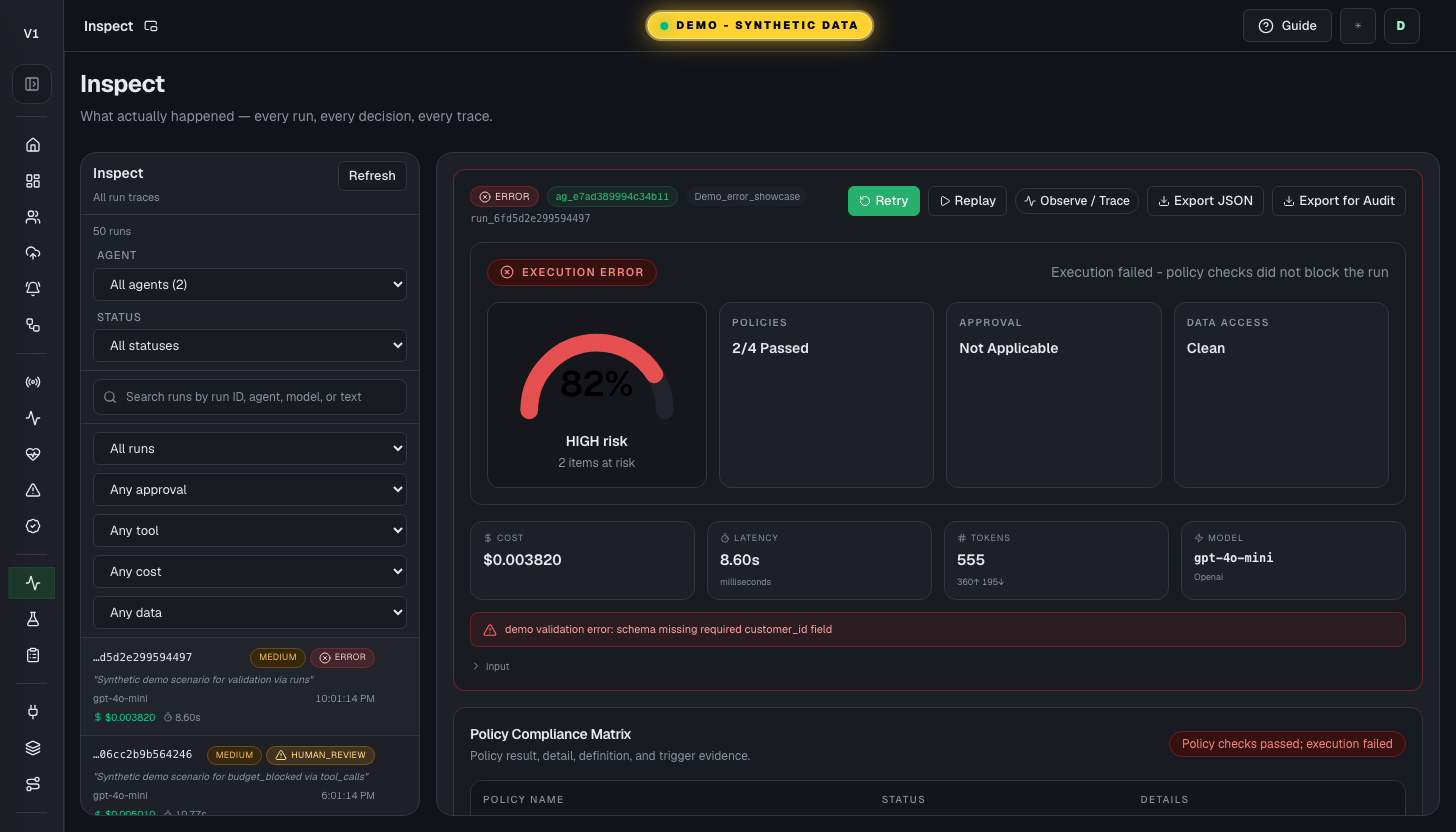
Inspect is the evidence and governance context page for runs.
Value to users
It shows status, latency, cost, tokens, events, inputs, outputs, policy compliance, approval chain, tool/data access, risk, and linked audit evidence.
Use it when
- A run succeeded, failed, or needs review.
- You need to understand what happened during a run.
- You need cost, latency, event timeline, or request evidence.
- A reviewer needs to know whether a run is approved, needs review, or violates policy.
Next safe action
Open the run, check the governance badge, expand any failed policy, inspect tool and data access, then compare with Audit when trust matters.
Options and features
| Option | What it does | Value it adds | How to use it |
|---|---|---|---|
| Run list | Lists recent or filtered runs. | Helps operators find the exact execution to inspect. | Filter by agent or run ID when possible. |
| Governance filters | Filters by policy result, approval type, tool, cost bucket, and data access. | Lets reviewers find high-risk evidence without reading every event row. | Combine filters, then clear active pills when the run list gets too narrow. |
| Risk badge | Shows Low, Medium, or High risk on every run row. | Keeps risk visible before the detail panel is open. | Hover the badge to see why cost, policy, data, or status drove the score. |
| Governance Summary Badge | Shows APPROVED, REVIEW NEEDED, or VIOLATION at the top of the run detail. | Gives compliance teams one first read before they inspect evidence. | Click the badge to jump to the Policy Compliance Matrix. |
| Policy Compliance Matrix | Lists pass, fail, or N/A rows for each policy that applies to the run. | Shows exactly which policy made the run clean or risky. | Expand any red row first, then compare the trigger evidence with Events and Audit. |
| Approval Chain Timeline | Shows run start, policy check, approval request or auto-approval, and completion. | Proves who or what allowed the run to proceed. | Read this before approving a retry or sharing run evidence with a customer. |
| Tool Usage & Data Access | Lists tool name, read/write action, source, PII flag, duration, and status. | Shows whether the run touched sensitive data or mutated an external system. | Open rows with write access or PII before treating the run as clean. |
| Complexity pressure | Connects run evidence back to overloaded-agent signals such as steps, retry loops, and capability touches. | Helps explain whether a failure is one bad run or a sign the agent's job is expanding beyond its design. | When pressure is elevated, compare Inspect evidence with Agent Status and Configure before adding more tools. |
| Export for Audit | Downloads the displayed run governance context as JSON. | Creates a portable compliance artifact without waiting for a backend export job. | Use it after verifying policy, approval chain, tool access, and audit context. |
| Timeline | Shows the ordered events for a selected run. | Explains how the run moved from start to finish. | Read from first event to terminal event before drawing conclusions. |
| Metrics | Shows latency, cost, token count, model, and status. | Makes performance and spend part of the trust decision. | Compare unusual values with Trace and Audit. |
| Linked audit evidence | Connects run evidence to tamper-evident events. | Proves that the inspectable run is recorded. | Open Audit when a customer, admin, or reviewer needs proof. |
Basic workflow
- 1Open the run by run ID or agent.
- 2Confirm the governance badge and run risk.
- 3Review the Policy Compliance Matrix and expand failing rows.
- 4Read the Approval Chain Timeline.
- 5Inspect Tool Usage & Data Access, especially PII or write access.
- 6Review metrics and event timeline.
- 7Export for Audit if the run needs portable compliance evidence.
- 8Open Trace for visual path if needed.
- 9Open Audit for tamper-evident proof.
Proof that it worked
- Run ID is stable.
- Status, latency, cost, tokens, and events are visible.
- Governance badge, policy matrix, approval chain, tool/data panel, risk badge, and filters are visible.
- Export for Audit downloads a JSON file for the selected run.
- Linked audit events exist for run start and run finish.
Before you start
- Confirm you are on /inspect and looking at the right workspace.
- Read visible status, warning, or empty-state text before clicking an action.
- If the page shows IDs, copy the relevant agent, run, onboarding, or request ID before switching pages.
If you get blocked
- If the page is empty, check whether filters, scope, or time window are hiding the data.
- If an action is locked, follow the visible lock reason before trying another route.
- If Inspect does not answer the question, open the linked evidence page instead of guessing.
What to confirm
- Am I on /inspect in the intended workspace?
- Which visible status, warning, or ID proves the current state?
- Which linked evidence page confirms this Inspect result?
Observe
What it is
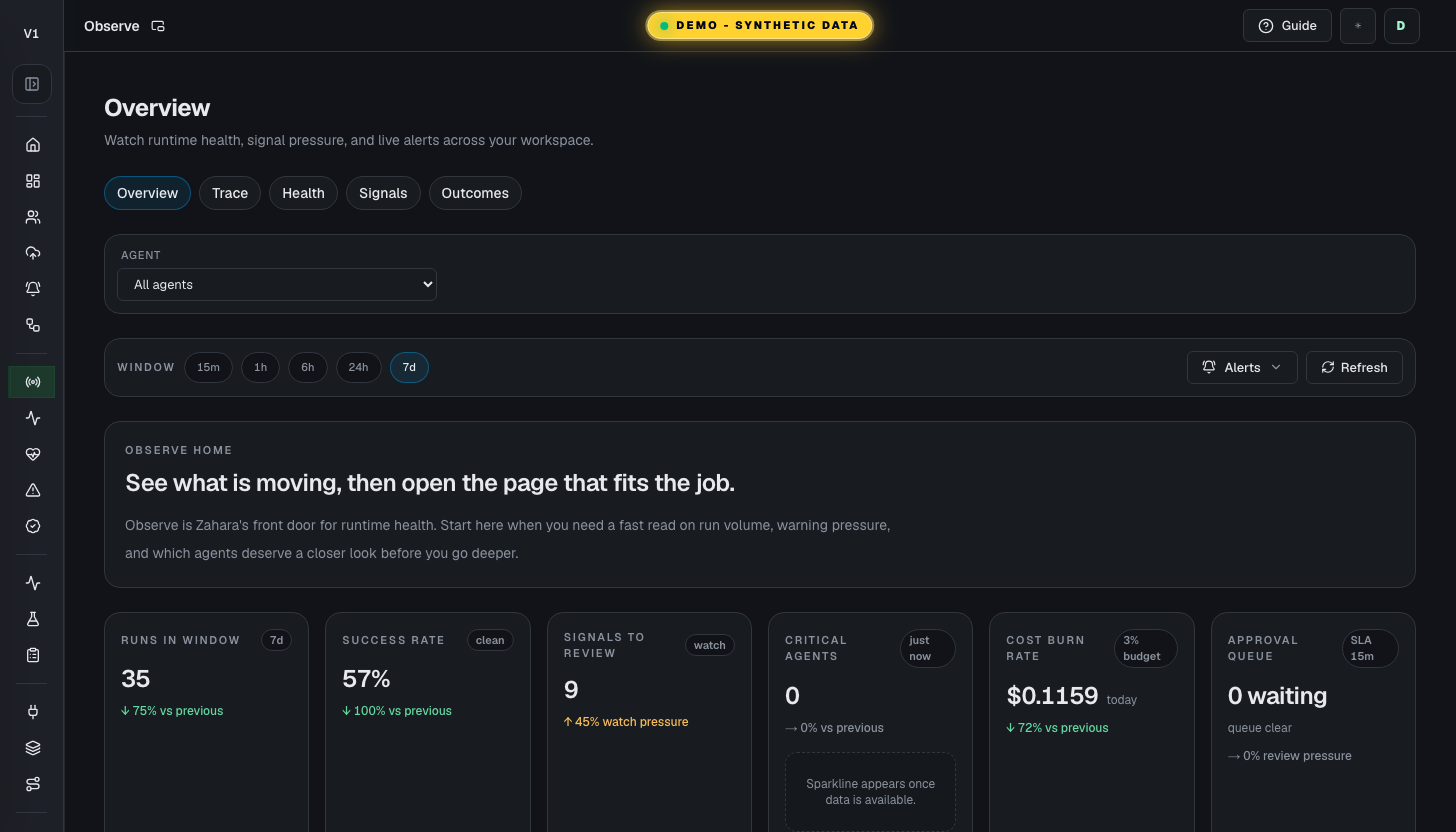
Observe is the front door for runtime health, risk, and investigation routing.
Value to users
It gives teams a live first read on run volume, warning pressure, and noisy agents before they choose the deeper observability page.
Use it when
- You want the fastest read on what needs attention right now.
- A new operator needs a clean way into observability.
- You need to choose between Signals, Health, and Trace before going deeper.
Next safe action
Start with Signals if you need a next-action queue, Health if you need a stability check, or Trace if you are already following one run.
Options and features
| Option | What it does | Value it adds | How to use it |
|---|---|---|---|
| Page pop-out | Launches a read-only Observe monitor for a second-screen runtime health wall from the app header. | Keeps warning pressure, noisy agents, activity, success rate, and critical-agent count visible while the operator investigates elsewhere. | Use the small pop-out icon beside the page title during live operations, then open Signals, Health, Trace, or the full app when the monitor shows drift. |
| Customize layout | Lets each browser reorder the Observe monitor cards and reset back to the default runtime wall. | Supports multi-monitor operator stations where one screen may prioritize KPIs, another may prioritize noisy agents, and another may prioritize the signal queue. | Open /observe/live, choose Customize layout, move cards up or down, and use Reset layout when you want the shared default again. |
| Live activity graph | Shows run volume, cost, and error rate for the selected window right on the Observe home page. | Lets teams see whether the workspace is quiet, active, or drifting before they click deeper. | Use the chart first when you need a fast read on what changed in the current window. |
| Top agents needing attention | Highlights the loudest or riskiest agents and links straight into their scoped Observe view. | Turns observability into a list of who to open first instead of forcing a blind hunt through Fleet. | Open the agent Observe link when one agent clearly looks noisier than the rest. |
| Observe home cards | Route the user to Signals, Health, or Trace based on the job at hand. | Keeps the Observe lane understandable for first-time operators after the live summary has set the context. | Use the card whose question matches what you need to decide next. |
| Current attention panel | Shows the top signals that deserve review right now. | Turns observability into a human-readable starting point instead of a chart wall. | Open the full signal queue if the warning list is growing or looks severe. |
| Live summary cards | Show recent runs, success rate, warning pressure, critical-agent count, cost burn rate, and approval queue age with sparklines. | Gives a fast trust check before users open a deeper page, including spend and review pressure. | Use the summary cards to decide whether the workspace looks calm or noisy. |
Basic workflow
- 1Open Observe when you need the best first route into runtime health.
- 2Use the page-title pop-out when Observe should stay visible on another screen.
- 3Use Customize layout on the monitor when this workstation needs a different card order.
- 4Read the sparkline summary cards, cost burn rate, approval queue, activity graph, and top-agent panel.
- 5Choose Signals, Health, or Trace based on the question you need answered.
- 6Move to the deeper page only after the Observe home points to the right lane.
Proof that it worked
- Summary cards load for the selected window, including Cost burn rate and Approval queue.
- The page pop-out opens the same runtime health story in a read-only auto-refreshing view.
- Customize layout reorders the Observe monitor for this browser and Reset layout restores the default.
- The live activity graph renders for the selected window.
- Top agents needing attention links into agent Observe pages.
- The page links clearly to Signals, Health, and Trace.
- Current attention explains whether the workspace is calm or needs review.
Before you start
- Confirm you are on /observe and looking at the right workspace.
- Read visible status, warning, or empty-state text before clicking an action.
- If the page shows IDs, copy the relevant agent, run, onboarding, or request ID before switching pages.
If you get blocked
- If the page is empty, check whether filters, scope, or time window are hiding the data.
- If an action is locked, follow the visible lock reason before trying another route.
- If Observe does not answer the question, open the linked evidence page instead of guessing.
What to confirm
- Am I on /observe in the intended workspace?
- Which visible status, warning, or ID proves the current state?
- Which linked evidence page confirms this Observe result?
Observe / Trace
What it is
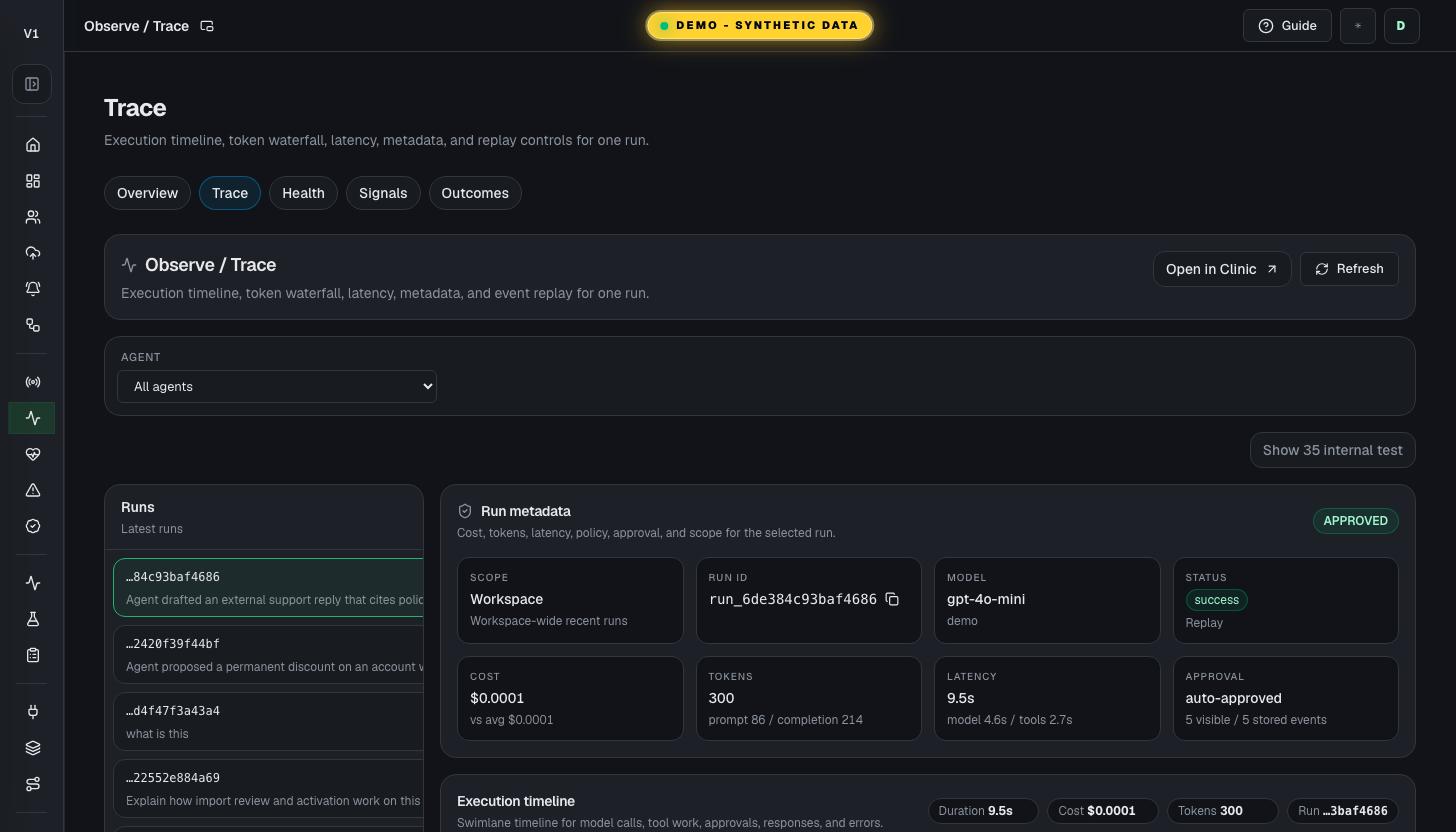
Observe / Trace is the execution debugger for one run, with a swimlane timeline, token waterfall, latency bottleneck view, metadata, and error recovery context.
Value to users
It helps teams explain exactly what happened in one run: where time went, where tokens were spent, which event mattered, and what to do next when a run fails.
Use it when
- Understand a run visually.
- Debug a slow, expensive, failed, or surprising run.
- Compare the agent path with Inspect evidence.
- Choose one agent without leaving Trace first.
Next safe action
Choose a run, scan the timeline flags, open the slowest or most expensive event, then use the waterfall and latency chart before opening Inspect for deeper proof.
Options and features
| Option | What it does | Value it adds | How to use it |
|---|---|---|---|
| Agent picker | Lets users switch between all recent runs and one agent's recent runs from the page itself. | Makes it easy to focus Trace without hunting through Fleet first. | Use the Agent picker at the top of the page, then clear it to return to all agents. |
| Agent scope | Keeps the run list, actions, and scope card tied to one agent. | Lets operators compare recent runs for the same agent without losing cockpit context. | Pick one agent on the page or open Trace from an agent page, agent Observe tab, or any link that carries the agent ID. |
| Execution timeline | Shows Init, LLM Reasoning, Tool Execution, Response, and Error swimlanes with duration-sized bars. | Makes the run path obvious and highlights slowest and most expensive steps. | Click a bar to inspect payload, model, tool, approval, or error details. |
| Token waterfall | Shows system prompt, user input, tool request/result, and model response token accumulation. | Makes prompt waste and tool-result bloat visible. | Click a segment to highlight the matching timeline step. |
| Latency per step | Ranks major steps by duration and names the current bottleneck. | Tells the operator whether to tune model, tools, approvals, or infrastructure first. | Start with the bottleneck callout, then open the same event in the timeline detail panel. |
| Run metadata | Shows model, cost, tokens, latency, policy compliance, approval status, and copyable run ID. | Puts the governance facts next to the trace instead of hiding them in separate pages. | Use this before sending a run ID to Audit, Inspect, or a teammate. |
| Error context | Explains failed runs in plain English with recovery actions and a similar-errors link. | Keeps operators from staring at raw errors without a next move. | Use it when the policy badge or run status says violation or error. |
| Open Inspect | Moves from visual trace to detailed metrics and events. | Lets users verify what the trace implies. | Open Inspect when status, cost, latency, or event detail matters. |
Basic workflow
- 1Open Trace from a run, agent, or Workboard proof packet.
- 2Choose one agent if you want the run list to stay in that agent's lane.
- 3Confirm the metadata panel matches the run and agent you meant to inspect.
- 4Read the execution timeline and open the flagged step.
- 5Use the token waterfall and latency chart to decide what caused cost or delay.
- 6Open Inspect or Audit if the path needs deeper proof.
Proof that it worked
- Execution timeline has phase swimlanes and event bars.
- Slowest and most expensive steps are visually flagged when present.
- Token waterfall, latency chart, metadata, and event detail agree on the selected run.
- Error context appears when a failed run is selected.
Before you start
- Confirm you are on /observe/trace and looking at the right workspace.
- Read visible status, warning, or empty-state text before clicking an action.
- If the page shows IDs, copy the relevant agent, run, onboarding, or request ID before switching pages.
If you get blocked
- If the page is empty, check whether filters, scope, or time window are hiding the data.
- If an action is locked, follow the visible lock reason before trying another route.
- If Observe / Trace does not answer the question, open the linked evidence page instead of guessing.
What to confirm
- Am I on /observe/trace in the intended workspace?
- Which visible status, warning, or ID proves the current state?
- Which linked evidence page confirms this Observe / Trace result?
Audit
What it is
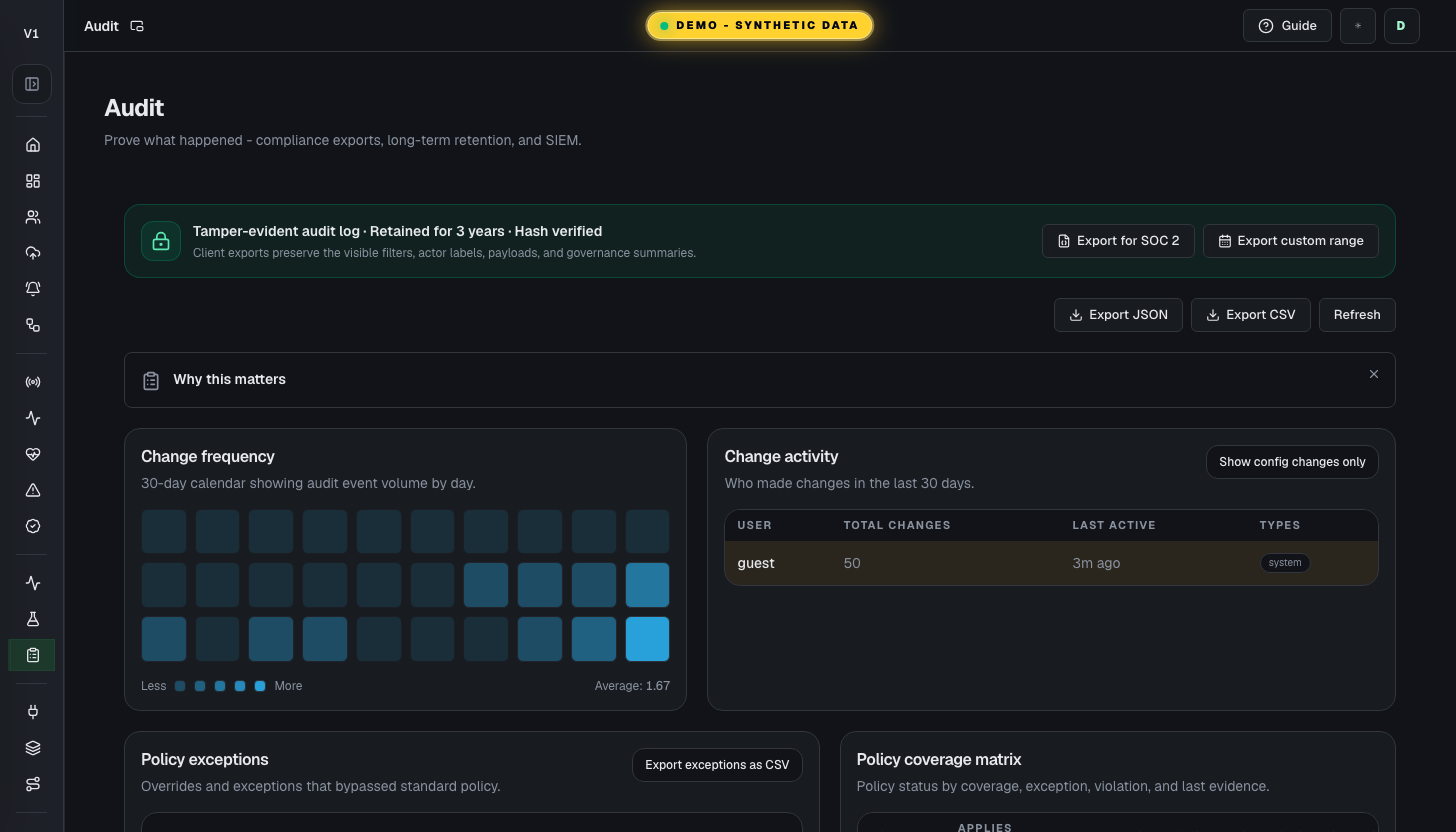
Audit is the compliance-ready evidence record: tamper-evident log, diff history, actor activity, policy exceptions, config versions, policy coverage, and client-side exports.
Value to users
It proves who changed what, when policy was bypassed, what version was active, and which evidence can be exported for review.
Use it when
- Prove that something happened.
- Verify matching run IDs and request IDs.
- Review historical import, activation, run, policy exception, or config-version decisions.
Next safe action
Start with the tamper-evident status and change heatmap, then narrow by actor, config change, policy exception, date, or entity ID.
Options and features
| Option | What it does | Value it adds | How to use it |
|---|---|---|---|
| Change frequency and activity | Shows high-change days and who changed what across model, tool, budget, and prompt categories. | Helps investigators find the likely change window before reading every event. | Click a heatmap day or actor row to filter the event log. |
| Diff viewer | Expands config-change events into before/after field diffs. | Makes prompt, model, tool, budget, and policy edits reviewable. | Use Show config changes only, then expand the row that matches the incident window. |
| Policy exceptions | Lists overrides that bypassed normal policy with reason, approver, duration, cost impact, and status. | Gives compliance teams one place to review active exceptions. | Resolve active exceptions before calling a release clean. |
| Config version history | Shows per-agent version timeline with hashes, diff actions, and rollback confirmation. | Connects audit events to recoverable agent versions. | Use Diff vs current before considering rollback. |
| Policy coverage matrix | Shows policies, clean coverage, exceptions, violations, status, and last evidence in a table. | Gives compliance reviewers a fast scan of what passed, what needs review, and what still has exceptions. | Start with any exception or review row, then open the matching audit event or export the visible evidence. |
Basic workflow
- 1Confirm the tamper-evident log indicator says hash verified.
- 2Use change frequency and actor activity to find the change window.
- 3Filter Audit to config changes, policy exceptions, or the entity ID.
- 4Expand diffs or version rows before deciding on rollback.
- 5Export SOC 2 or a custom range when the evidence needs to leave Zahara.
Proof that it worked
- Tamper-evident retention and hash status are visible.
- Change heatmap, actor matrix, policy exceptions, version history, and policy coverage matrix render.
- Config-change rows can expand into before/after diffs.
- Export buttons download visible filtered audit evidence.
Before you start
- Confirm you are on /audit and looking at the right workspace.
- Read visible status, warning, or empty-state text before clicking an action.
- If the page shows IDs, copy the relevant agent, run, onboarding, or request ID before switching pages.
If you get blocked
- If the page is empty, check whether filters, scope, or time window are hiding the data.
- If an action is locked, follow the visible lock reason before trying another route.
- If Audit does not answer the question, open the linked evidence page instead of guessing.
What to confirm
- Am I on /audit in the intended workspace?
- Which visible status, warning, or ID proves the current state?
- Which linked evidence page confirms this Audit result?
Team
What it is
Team is the Settings surface for workspace people, invitations, workspace switching, and the viewer / operator / admin role model.
Value to users
It controls who can view, operate, or administer the workspace without forcing teams to share accounts.
Use it when
- Add operators, reviewers, or teammates.
- A user needs role access.
- A workspace needs a cleaner handoff from admin to team users.
- A demo or customer workspace needs least-privilege access before anyone touches live operations.
- An agency, operator team, or consultant manages multiple client accounts and needs each client separated with read-only client access.
Next safe action
Open Settings, then Team. Invite only the people who need access, give the least powerful role that fits, and confirm their access. Use Copy link whenever the page does not confirm email delivery.
Fresh screenshots are pending. Capture updated demo-safe images before publishing this guide publicly.
Use the written steps until a current, privacy-safe image is available. Add only an image that shows this exact page and state.
Options and features
| Option | What it does | Value it adds | How to use it |
|---|---|---|---|
| Workspace summary | Shows the active workspace, available teams, active members, and your current role. | Keeps users from changing the wrong workspace or assuming they have admin rights when they do not. | Check this first before inviting, switching workspaces, or changing roles. |
| Viewer role | Allows read-only access to workspace pages and evidence without day-to-day mutation rights. | Best for reviewers, observers, and demo viewers who need visibility but should not run, edit, approve, or administer the workspace. | Start here when a person only needs to inspect Command Center, Fleet, Observe, Trace, Audit, Gateway, docs, or other read-only evidence. |
| Operator role | Adds day-to-day operating rights such as creating/updating agents, running/retrying/canceling/replaying runs, managing workboard/fleet runtime operations, configuring capability bindings, and approving operational changes where the API allows operator access. | Best for trusted operators who need to move work but should not own credentials, team access, service tokens, or destructive admin cleanup. | Use operator for daily agent operations, then check Audit after high-impact actions. |
| Admin role | Adds sensitive administration rights such as inviting/removing members, changing roles, managing provider keys and workspace credentials, creating/revoking workspace service tokens, deleting agents/runs, and other owner-level controls. | Keeps secrets, team access, and destructive actions limited to trusted workspace owners. | Use admin sparingly. Prefer one owner and one trusted backup rather than making every operator an admin. |
| Invite teammate | Creates a role-scoped invitation and shows its delivery state with a copy-link path. | Lets real testers or teammates join with their own account instead of sharing credentials. | Admins enter the email, choose viewer/operator/admin, create the invitation, then read the delivery result. Use Copy link when email delivery is unavailable or delayed. |
| Pending and incoming invitations | Shows invitations sent from the active team and invitations waiting for the current user. | Makes handoff state visible before a demo, customer review, or workspace setup. | Resend, revoke, or copy pending invitations as an admin; accept incoming invitations when joining a workspace. |
| Approval reviewer readiness | Shows reviewer availability and any retained legacy review setting. Managed approvals do not enforce a distinct second approver. | Helps identify available reviewers without implying a workspace-wide two-person approval guarantee. | Invite a trusted operator or admin when another reviewer is needed. The second-approver control is unavailable; existing legacy review settings remain unchanged. |
| Workspace switcher | Creates or switches isolated workspaces/teams for testing and operations. | Prevents data and access from mixing across customer, internal, demo, or test workspaces. | Confirm the active workspace before running agents, changing roles, or updating credentials. |
| Client account pattern | Uses one isolated workspace per client account, with internal operators managing work and client contacts invited as viewers when they only need read access. | Lets teams manage many customer accounts without mixing agents, credentials, runs, approvals, or audit evidence. | Create or switch to the client workspace, invite internal staff as operator/admin, invite client contacts as viewer, then confirm the active workspace before making changes. |
Basic workflow
- 1Open Settings -> Team.
- 2Confirm the active workspace is correct.
- 3Choose the least-powerful role that fits the job: viewer, operator, or admin.
- 4Invite the teammate with that role.
- 5If the email does not arrive, use Copy link from Pending invitations and send the accept URL directly.
- 6Have them accept the invitation and sign in.
- 7Verify they can reach the needed pages and cannot see controls outside their role.
- 8Confirm solo mode or a second operator/admin matches the workspace's approval policy.
- 9Use Audit or visible team state to confirm sensitive role/access changes.
- 10For client management, keep each client in its own workspace and invite clients as viewers unless they need operator rights.
Proof that it worked
- Member appears in Team.
- Role is one of viewer, operator, or admin and matches intended access.
- Pending invitations show email, role, expiry, resend, revoke, and Copy link until accepted or revoked.
- Incoming invitations can be accepted by the invited account.
- Reviewer availability is not proof of two-person enforcement. Existing legacy requester/reviewer restrictions remain; managed approvals do not enforce them.
- Client viewers can inspect status and evidence without receiving admin-only controls.
- User can access private pages without guest mode.
- Viewer users do not get admin-only credential, role, service-token, or delete controls.
- Operator users can perform approved day-to-day operations without owning secrets or team access.
- Admin-only changes are limited to admin users.
Before you start
- Confirm you are on /settings/team and looking at the right workspace.
- Read visible status, warning, or empty-state text before clicking an action.
- If the page shows IDs, copy the relevant agent, run, onboarding, or request ID before switching pages.
If you get blocked
- If the page is empty, check whether filters, scope, or time window are hiding the data.
- If an action is locked, follow the visible lock reason before trying another route.
- If Team does not answer the question, open the linked evidence page instead of guessing.
What to confirm
- Am I on /settings/team in the intended workspace?
- Which visible status, warning, or ID proves the current state?
- Which linked evidence page confirms this Team result?
Feedback
What it is
Feedback is the in-product place to report bugs, confusing moments, suggestions, or praise.
Value to users
It gives users a direct way to tell the team what blocked them while the context is still fresh.
Use it when
- A user hits friction.
- A user cannot tell what to do next.
- A page is confusing or missing needed evidence.
Next safe action
Submit a clear title, what happened, what was expected, and the page where it happened. Use your team's incident route for urgent production problems because this page does not promise a response time.
Fresh screenshots are pending. Capture updated demo-safe images before publishing this guide publicly.
Use the written steps until a current, privacy-safe image is available. Add only an image that shows this exact page and state.
Options and features
| Option | What it does | Value it adds | How to use it |
|---|---|---|---|
| Feedback form | Captures the issue, suggestion, or confusion. | Turns user friction into product signal. | Write what happened, what was expected, and where it happened. |
| Category or severity | Classifies the feedback. | Helps the team prioritize urgent blockers. | Use blocker only when the workflow cannot continue. |
| Submit | Stores the report in the active workspace feedback list. | Keeps the issue attached to the workspace and visible to authorized users. | Submit while the page context is fresh. |
Basic workflow
- 1Open Feedback from the page where friction happened.
- 2Describe what happened and what was expected.
- 3Include route, agent, run, or onboarding ID if visible.
- 4Submit and continue with a workaround if possible.
Proof that it worked
- Feedback appears in Recent workspace feedback.
- Report includes enough context to reproduce or understand the issue.
- No password, token, provider key, private prompt, or customer data is included.
Before you start
- Confirm you are on /feedback and looking at the right workspace.
- Read visible status, warning, or empty-state text before clicking an action.
- If the page shows IDs, copy the relevant agent, run, onboarding, or request ID before switching pages.
If you get blocked
- If the page is empty, check whether filters, scope, or time window are hiding the data.
- If an action is locked, follow the visible lock reason before trying another route.
- If Feedback does not answer the question, open the linked evidence page instead of guessing.
What to confirm
- Am I on /feedback in the intended workspace?
- Which visible status, warning, or ID proves the current state?
- Which linked evidence page confirms this Feedback result?
Login
What it is
Login is the secure entry point for existing workspaces.
Value to users
It keeps private workspace data behind authenticated access.
Use it when
- A user already has an account.
- A private route redirects them to sign in.
- A user needs to return to their workspace.
- A new operator wants the dedicated onboarding path before opening Fleet or Command Center.
Next safe action
Sign in with the workspace account. If no next parameter is present, first-time users start in Onboarding; returning users with onboarding complete start in Command Center.
Options and features
| Option | What it does | Value it adds | How to use it |
|---|---|---|---|
| New user happy path | Shows the collapsible first-run path before sign-in. | Sets the expectation that Onboarding is the first door and Command Center is the daily default after setup. | Keep it open for first-time operators; collapse it when returning users already know the path. |
| Email and password | Authenticates a real workspace user. | Prevents anonymous guest access to private work. | Use the company/workspace account assigned during onboarding. |
| Next redirect | Returns the user to the page they originally requested. | Keeps sign-in from breaking the workflow. | After login, confirm the browser lands on the intended page. |
| Fleet shortcut | Sets next=/agents when the first job is reviewing or operating an existing agent. | Keeps Fleet available without making it the default first-run destination. | Use Open Fleet after sign-in only when the operator should skip directly to agent review. |
Basic workflow
- 1Open the login page.
- 2Read or collapse the new-user happy path.
- 3Enter workspace credentials.
- 4Confirm the redirect returns to the target page, Onboarding, or Command Center.
- 5From Onboarding, pick Build, Upload, or Connect before entering Command Center.
- 6From Command Center, check Team, Credentials, Agent, and Operate readiness before the first live run.
Proof that it worked
- User is authenticated.
- Private routes load without guest mode.
- The happy path explains Onboarding as the first-run starting point.
Before you start
- Confirm you are on /login and looking at the right workspace.
- Read visible status, warning, or empty-state text before clicking an action.
- If the page shows IDs, copy the relevant agent, run, onboarding, or request ID before switching pages.
If you get blocked
- If the page is empty, check whether filters, scope, or time window are hiding the data.
- If an action is locked, follow the visible lock reason before trying another route.
- If Login does not answer the question, open the linked evidence page instead of guessing.
What to confirm
- Am I on /login in the intended workspace?
- Which visible status, warning, or ID proves the current state?
- Which linked evidence page confirms this Login result?
Register / Signup
What it is
Register is the account intake path.
Value to users
It creates a real workspace request using company identity instead of anonymous demo access.
Use it when
- A new user needs access.
- A sales team is onboarding a real company.
- A user has a company email and matching company website.
- A first-time operator needs the setup path before seeing the full app.
Next safe action
Enter name, company email, company name, company website, and password. New accounts start in Onboarding unless a next route or Fleet shortcut is used.
Options and features
| Option | What it does | Value it adds | How to use it |
|---|---|---|---|
| New user happy path | Shows the collapsible Onboarding to Team to Credentials to Agent to Operate setup path before signup. | Gives new users one safe route into the platform instead of dropping them into a blank or unfamiliar workspace. | Use it to explain the first session; collapse it when the user is already trained. |
| Full name | Identifies the human requesting access. | Makes follow-up and workspace setup personal. | Use the tester's real name. |
| Company email | Validates the request against a company domain. | Keeps access tied to real organizations. | Use the work email, not a free personal email. |
| Company name and website | Captures the organization context. | Helps sales and onboarding understand who is requesting access. | Use the real company name and public website. |
| Fleet shortcut | Sets next=/agents for teams whose first task is reviewing existing agents. | Preserves the agent-review path without making Fleet the default for every new user. | Use Open Fleet after signup only when the operator already knows they need Fleet first. |
Basic workflow
- 1Open Register.
- 2Read or collapse the new-user happy path.
- 3Enter real identity and company fields.
- 4Submit and land in Onboarding by default.
- 5Choose Build, Upload, or Connect from the onboarding page.
- 6Follow Team, Credentials, Agent, and Operate readiness before the first live run.
Proof that it worked
- Signup rejects free email domains.
- Signup records name, company email, company name, and website.
- Intake is routed for admin follow-up.
- The happy path explains the default Onboarding landing.
Before you start
- Confirm you are on /register and looking at the right workspace.
- Read visible status, warning, or empty-state text before clicking an action.
- If the page shows IDs, copy the relevant agent, run, onboarding, or request ID before switching pages.
If you get blocked
- If the page is empty, check whether filters, scope, or time window are hiding the data.
- If an action is locked, follow the visible lock reason before trying another route.
- If Register / Signup does not answer the question, open the linked evidence page instead of guessing.
What to confirm
- Am I on /register in the intended workspace?
- Which visible status, warning, or ID proves the current state?
- Which linked evidence page confirms this Register / Signup result?